How to Build an Ubuntu Bastion Host for VCFA 9.x and Holodeck

I started using HoloDeck in earnest late last year. The ease of deploying and redeploying VCF 9 environments has been a godsend as I learn some of the new VCF Automation features.

The Holorouter and Webtop were good enough to get started. They were close to the environment, already had useful tools, and saved me from building another machine before I understood what I was trying to reach.

I quickly discovered that neither of the available working environments was particularly well suited to development. I couldn’t install the applications I needed in the Webtop terminal, which made it difficult to work with Kubernetes, perform meaningful development, or even track and save my work with Git.

Using the router OS prompt came with its own risks. For example, don’t even think about installing VCF.PowerCLI—it can break the PowerShell scripts used to deploy HoloDeck.

Then there was the time-consuming process of copying information out of the environment. Whether it was a template, a certificate, or a piece of command output, getting it back to my Mac required a multistep workflow: save it to a text file, SSH into another system, transfer it with SCP, and then retrieve it locally.

The process worked, but it felt like using a filing cabinet to pass a sticky note across the room. To put it mildly, it made about as much sense as putting a screen door on a submarine.

Webtop got us moving, but using it for everyday file transfer felt a little like installing a screen door on a submarine.

This article keeps things practical. It explains why I built the bastion, how its two network connections work, which routes it uses, and how to connect through it.

The answer was a small Ubuntu bastion host: a normal SSH destination, a place to run the VCF CLI and kubectl, and an SSH SOCKS5 bridge for browser and API access from my Mac.

The addresses below are sanitized examples from a VCFA 9.1 HoloDeck environment. Replace them with the values from your own environment before running commands.

The Mac stays comfortable on the outside while the bastion handles the route into HoloDeck.

What the bastion is for

The bastion gives me one reliable place to work from:

Mac
|
| normal SSH, file transfer, and optional SOCKS5 tunnel
v
Ubuntu bastion
|
| ens34 on VM Network, static management address
|
| ens37 on Holo-PG-A, static transit routes
v
Holorouter -> HoloDeck environment

From my Mac, the bastion behaves like an ordinary Linux host. That fixes the copy-and-paste problem immediately. It also gives me a clean home for tools, scripts, temporary certificates, and command history without making the Holorouter or Webtop carry the entire workflow.

The bastion is not a replacement for the Holorouter. It is a carefully placed client of the HoloDeck routing path.

The two network connections

The primary interface connects to the vSphere port group named:

VM Network

For this article, use a static example address in a separate private management network:

192.168.50.10/24

The address is illustrative only. Replace it with an unused address, prefix, gateway, and DNS settings that belong to your own VM Network. Do not use 192.168.50.10/24 blindly, and do not choose a range that overlaps the HoloDeck routes or your local Mac network.

Use this side for ordinary SSH management from the Mac. A static address makes the bastion easier to find after a reboot, but it also makes address management your responsibility. Record the assignment in your normal IPAM or lab notes.

The second interface connects to:

Holo-PG-A

Holo-PG-A is the native VLAN for the site-a HoloDeck environment. This is the internal, Holorouter-facing connection. On the bastion, it appears as ens37 and connects to the following transit network:

10.1.10.128/25

The validated example used:

ens37 address: 10.1.10.229/25
Holorouter next hop: 10.1.10.129

The exact address can change. The interface role and next hop are the important parts.

One interface preserves normal management; the other owns the specific routes into HoloDeck.

Create the Ubuntu VM

Create a small Ubuntu VM using the normal VCFA or vSphere process for your environment. The bastion does not need to be large for this job; it needs reliable networking and enough disk for tools, logs, and temporary artifacts.

Attach two virtual network adapters:

  1. The first adapter to VM Network for static management access.
  2. The second adapter to Holo-PG-A for HoloDeck transit access.

Install Ubuntu and enable SSH. During the first login, update the system and install the small set of tools used throughout this article:

sudo apt update
sudo apt upgrade
sudo apt install -y \
curl \
dnsutils \
git \
jq \
netcat-openbsd \
network-manager \
openssh-server
  • curl tests HTTP and HTTPS endpoints.
  • dnsutils provides DNS troubleshooting commands such as dig and nslookup. The article uses getent, which Ubuntu provides separately through the base system.
  • git provides version control for scripts and configuration files.
  • jq filters and formats JSON returned by APIs and command-line tools.
  • netcat-openbsd performs simple TCP connectivity tests when an application-level request is not appropriate.
  • network-manager provides nmcli, which is used to configure the two interfaces and persistent routes.
  • openssh-server provides remote shell access, file transfers, and the SOCKS5 tunnel.

Only curl, network-manager, and openssh-server are essential to the connectivity workflow demonstrated here. Git supports the bastion’s development role, while dnsutils, jq, and netcat-openbsd are useful troubleshooting tools. Tools such as the VCF CLI and kubectl can be installed separately when their workflows are introduced.

I opted to use SSH key authentication primarily so I could give a Codex agent secure access to the environment for testing and developing scripts and solutions. That experience is a blog article in its own right—and one I’m looking forward to writing.

Identify the interfaces before adding routes

Ubuntu interface names depend on the image and installation. Do not assume that the management adapter is always ens34 or that the transit adapter is always ens37.

On the bastion, inspect the addresses and connection names:

ip -br address
nmcli device status
nmcli connection show

For the rest of this article, the example assumes:

  • ens34 is connected to VM Network and uses the static management address.
  • ens37 is connected to Holo-PG-A and uses the static transit address.

If your interface names differ, substitute them consistently.

Configure the management interface

Set the management address according to your local gateway and DNS design. The following is an illustrative NetworkManager example only:

MGMT_CONNECTION="$(
nmcli -g GENERAL.CONNECTION device show ens34
)"
sudo nmcli connection modify \
"${MGMT_CONNECTION}" \
ipv4.method manual \
ipv4.addresses '192.168.50.10/24' \
ipv4.gateway '192.168.50.1' \
ipv4.dns '192.168.50.1'

Replace 192.168.50.1 with the real management gateway and DNS server, or omit the DNS value if your environment supplies name resolution another way. Confirm the management route before applying changes over SSH.

Configure the HoloDeck-facing interface

First identify the NetworkManager connection attached to ens37:

ENS37_CONNECTION="$(
nmcli -g GENERAL.CONNECTION device show ens37
)"
printf 'ens37 connection: %s\n' "${ENS37_CONNECTION}"

Set the transit address and prevent this interface from installing a second default route:

sudo nmcli connection modify \
"${ENS37_CONNECTION}" \
ipv4.method auto \
ipv4.never-default yes

The ipv4.never-default yes setting matters. The bastion should keep its normal management default route on the VM Network interface. The HoloDeck-facing interface needs specific routes, not a competing default route.

Add all of the HoloDeck routes

The route table that matters is the one installed through ens37:

10.1.0.0/16 via 10.1.10.129 dev ens37 proto static metric 101
10.1.10.128/25 dev ens37 proto kernel scope link src 10.1.10.229 metric 101
10.2.0.0/16 via 10.1.10.129 dev ens37 proto static metric 101
10.100.0.0/27 via 10.1.10.129 dev ens37 proto static metric 101

The following output shows the Holorouter interface connected to the same transit network. Its address, 10.1.10.129, becomes the next hop for the bastion’s static routes:

3: eth1: <BROADCAST,MULTICAST,UP,LOWER_UP> mtu 8000 qdisc mq state UP group default qlen 1000
link/ether 00:0c:29:bc:87:9f brd ff:ff:ff:ff:ff:ff
altname eno2
altname enp19s0
altname ens224
inet 10.1.10.129/25 scope global eth1
valid_lft forever preferred_lft forever
4: eth2: <BROADCAST,MULTICAST> mtu 1500 qdisc noop state DOWN group default qlen 1000

The connected route is created by the interface address. The three static routes reach the wider HoloDeck networks through the Holorouter at 10.1.10.129:

  • 10.1.0.0/16: HoloDeck site-a services and transit networks.
  • 10.2.0.0/16: future or current VCFA workload networks.
  • 10.100.0.0/27: Supervisor Kubernetes management-plane services in the validated lab.

Preserve any routes already present on the connection. The following example expresses the intended static route set:

The route table captures both validated service paths and future workload reachability.
sudo nmcli connection modify \
"${ENS37_CONNECTION}" \
ipv4.routes \
"10.1.0.0/16 10.1.10.129 101,10.2.0.0/16 10.1.10.129 101,10.100.0.0/27 10.1.10.129 101"
sudo nmcli device reapply ens37

If NetworkManager reports that a reapply is not possible, schedule a controlled connection restart or reboot. Do not casually cycle the only interface you are using for SSH access.

Check route ownership

The route table should make the intended ownership visible:

ip route
ip route get 10.100.0.2
ip route get 10.2.0.10

The Supervisor example should report a path similar to:

via 10.1.10.129 dev ens37 src 10.1.10.229

The last address is only an example from the 10.2.0.0/16 workload range. Do not treat it as proof that a workload exists. It proves that the route is selected; a real connection is needed to prove the destination path.

Also confirm that the management default route still belongs to the VM Network side:

ip route show default

Validate DNS and vCenter reachability

Test the path from the bastion before involving the Mac browser:

getent ahostsv4 vc-mgmt-a.site-a.vcf.lab
curl -skI \
--connect-timeout 5 \
--max-time 15 \
https://vc-mgmt-a.site-a.vcf.lab/

In the validated environment, vCenter returned an HTTPS response through the bastion, confirming that DNS resolution and network connectivity were working. For a trusted final configuration, install the appropriate vCenter CA certificate and repeat the request without -k. The insecure option is useful for isolating routing and certificate issues in a lab, but it should not become part of the permanent configuration.

You can also test connectivity to the Supervisor Kubernetes API server endpoint:

curl -sk \
--connect-timeout 5 \
--max-time 15 \
https://10.100.0.2/version

An authentication response can still prove that the network and TLS endpoint were reached. A timeout points to routing, firewall, or service availability rather than a bad Kubernetes command.

Use SSH normally from the Mac

Connect to the bastion through its static address on VM Network:

ssh ubuntu@<bastion-management-ip>

For repeat use, add a host entry to the Mac’s SSH configuration:

Host holodeck-bastion
HostName <bastion-management-ip>
User ubuntu
IdentityFile ~/.ssh/<bastion-key>

Now copying commands, editing files, and using kubectl feel like normal work again. Files can move directly with scp when needed:

scp ./local-file.txt holodeck-bastion:/tmp/local-file.txt
scp holodeck-bastion:/tmp/result.txt ./result.txt

Add a SOCKS5 tunnel when the browser needs the route

SSH can also create a local SOCKS5 listener on the Mac:

ssh -N \
-D 127.0.0.1:1080 \
holodeck-bastion

The listener is bound to localhost, so it is not exposed to the rest of the local network.

Configure Firefox or another browser with:

SOCKS host: 127.0.0.1
Port: 1080
SOCKS v5: enabled
Proxy DNS: enabled

Proxy-side DNS is important for names such as vc-mgmt-a.site-a.vcf.lab. Without it, the Mac may try to resolve the internal name locally before the request ever reaches the bastion.
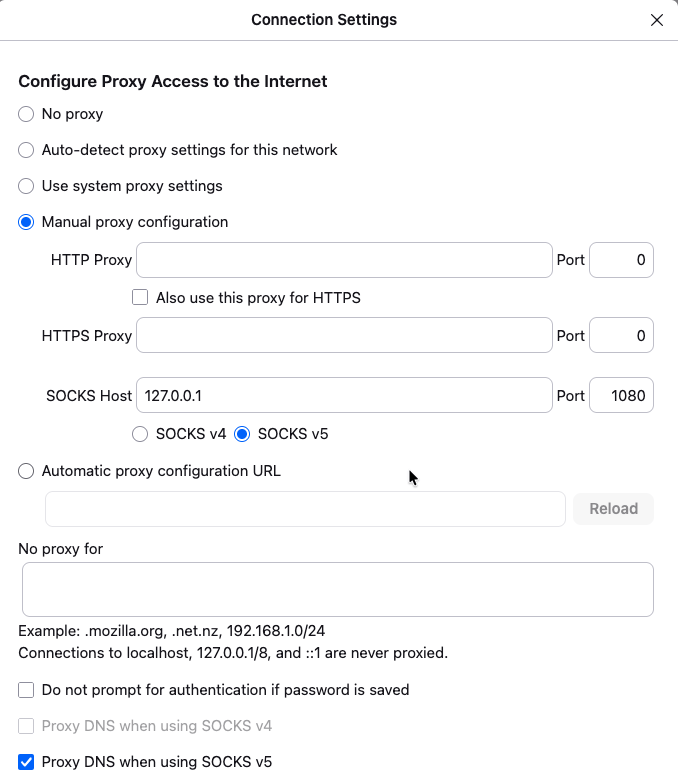
Validated Firefox SOCKS Proxy Settings.

Test the tunnel from the Mac with socks5h, where the h means hostname resolution happens through the proxy:

curl -sk \
--proxy socks5h://127.0.0.1:1080 \
--connect-timeout 5 \
--max-time 15 \
https://vc-mgmt-a.site-a.vcf.lab/

This is the part Webtop never made especially pleasant. The browser stays on the Mac, copy and paste stays on the Mac, and the bastion supplies the route into the HoloDeck environment.

Here is a screenshot of the Firefox tabs on my Mac. As you can see, the SOCKS5 tunnel provides access to several deployed HoloDeck resources.

Remote Firefox access through a SOCKS proxy into the HoloDeck environment

Why this route is worth keeping

The bastion is deliberately uncomplicated:

  • Management arrives through VM Network using a static example address.
  • HoloDeck traffic leaves through Holo-PG-A and ens37.
  • The normal default route remains on the management side.
  • Specific HoloDeck networks use the Holorouter next hop.
  • SSH provides the working session and file transfer.
  • SOCKS5 provides browser and API access when the Mac cannot route directly.

This avoids changing the Holorouter’s VRF behavior, BGP, reverse-path filtering, proxy configuration, or system-wide socket behavior. Those components can remain responsible for the routing they already own.

What the bastion proves, and what it does not

A successful vCenter connectivity test proves that the bastion can resolve the vCenter hostname, route traffic to the destination, and receive an HTTPS response. It does not prove that every HoloDeck service or workload is reachable. Each destination still requires its own connectivity and application-level validation.

Similarly, the persistent 10.2.0.0/16 route proves that the bastion knows where future VCFA workload traffic should go. It does not prove SSH to a real workload until one exists and a connection has been tested.

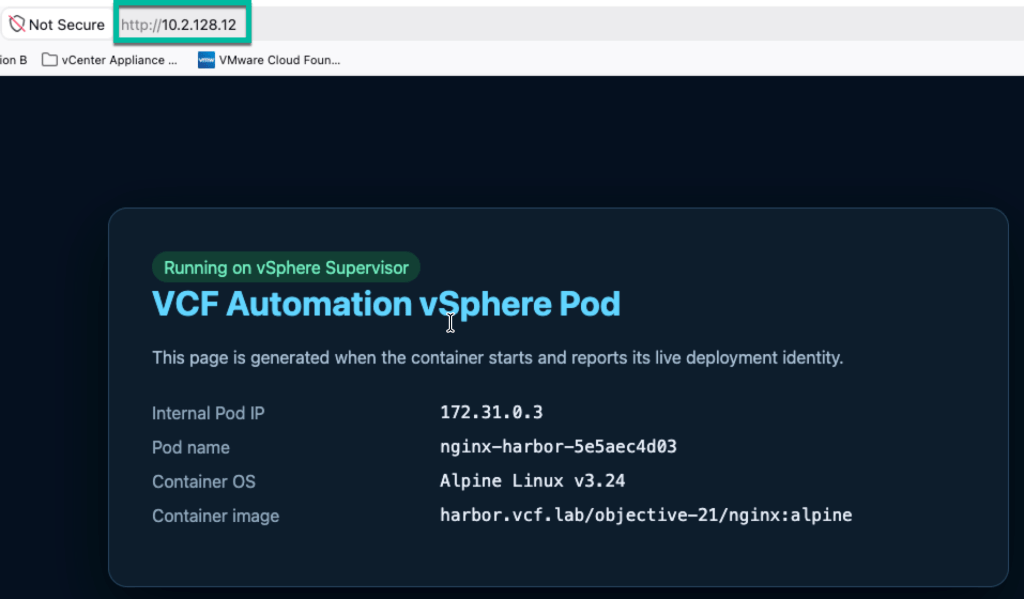
Once workload access is configured, the same path can provide HTTP or SSH access to deployed machines. For example, the following screenshot shows access to a load-balanced vSphere Pod deployed through VCF Automation. That workflow will be the subject of a future article.
Keeping those evidence boundaries separate is the difference between “the route is configured” and “the application path works.”

Next steps

With the bastion in place, I now have a practical workstation for managing and developing against the HoloDeck environment. It provides a central location for running the VCF CLI, kubectl, diagnostic utilities, and other development tools without modifying the router OS or relying on Webtop’s cumbersome file-transfer process. It also gives me a clean foundation for testing additional services and workflows in future articles.

Disclaimer: Some of the stuff you see here has been checked out, tweaked, or even created by AI. Welcome to the new age, folks!

Managing Azure AKS clusters with VMWare Aria Automation

The use case presented to me for POC was to deploy a new Azure AKS cluster then install a basic application. Simple use case, but for those using VRA you know the kubernetes capabilities are all but non existent.

But after digging around and tinkering I figured a CodeStream (now called Pipelines) would probably fit the bill. The pipeline would run a terraform plan to build, and then destroy the deployment later on.

Keeping track of the state file between runs also presented a ‘problem’. After lots of kicking the tires I came up with a way to store the state file securing in an Azure Storage account. The state file in the container is simply the deployment name plus .tfstate. This allowed me to refer to it using day two actions and Event Broker Subscriptions (EBS).

Another issue that came up was deleting ‘codestream.execution’ resources when the deployment is deleted. Since these deployments are handled by terraform I needed another WF which called a pipeline to destroy the deployment when the eventType was DESTROY_DEPLOYMENT.

The files for this article can be found at azure-terraform-blog

Terraform is used to do the heavy lifting. The backend values get replaced with some pipeline inputs in the first pipeline task. The most important one is the deployment name. When destroying the deployment, terraform will pull the current state for that deployment and do its thing.

The CodeStream pipeline (Now Pipelines) uses a custom docker image. It includes the latest version of Terraform (Currently at 1.5.4), AZ CLI, Kubectl, and Helm (for another use case). It is stored on DockerHub as americanbwana/cas-terraform-154:latest.

I didn’t come up with the basic Template. I found this article on vEducate.co.uk. A very good starting point. ‘pipelineTask’ is used by the pipeline to either create (apply) or destroy the deployment. More on that later.

formatVersion: 1
inputs:
  pipelineTask:
    type: string
    title: Pipeline Task
    description: 'Create '
    readOnly: true
    default: create
resources:
  cs.pipeline:
    type: codestream.execution
    properties:
      pipelineId: 2b80427c...
      outputs:
        computed: true
      inputs:
        deploymentName: ${env.deploymentName}
        pipelineTask: ${input.pipelineTask}

vRA doesn’t delete the actual codestream.execution items when you destroy the deployment. A workflow called ‘Terraform delete AKS and Helm deployment’ is called by an Event Broker Subscription (EBS). Make sure to update the ‘codestreamPipelineId’ in the WF variables.

Event Broker Subscription

And finally on to the pipeline. The initialize task copies several variables into a file, which is then sourced by most stages. Terraform apply is only fired if the pipelineTask = ‘create’. And Terraform destroy is only fired when pipelineTask = ‘destroy’.

Pipeline

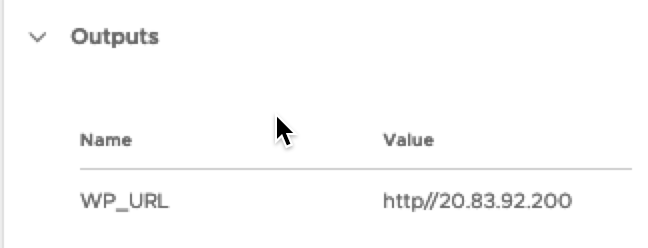
‘Get Service IP’ is also only fired if the pipelineTask = ‘create’. This task will get the IP address of WordPress and export it back to vRA.

Terraform Output
Assembler Output

Nuff for now. Happy coding.

vRO Action PowerShell Zip importing and use

One of my current tasks is to leverage vRealize Automation Orchestrator to meet the following use case.

  • Get the next available subnet from InfoBlox
  • Reserve the gateway and other IP’s in the new subnet
  • Create a new NSX-T segment
  • Create new NSX-T security groups
  • Discover the new segment in vRealize Automation Cloud
  • Assign the new InfoBlox to the discovered Fabric Network
  • Create a new Network Profile in vRA Cloud

This weeks goal was to get the InfoBlox part working. Well I had it working two years ago, but couldn’t remember how I did it (CRS).

Today I’ll discuss how to use vRO to get the next available subnet from InfoBlox. The solution uses a PSM I build, along with the PowerShell script which actually does the heavy lifting. One key difference between my solution and the one from VMware’s documentation is the naming of the zip file. This affects how to import and use it in vRO.

The code used in this example is available in this GitHub repo. Clone the repo, then run the following command to zip up the files.

zip -r -x ".git/*" -x "README.md" -X nextibsubnet.zip .

Next import the zip file into vRO, add some inputs, modify the output, then finally run it.

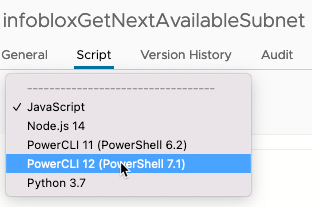
Within vRO, add a new Action. Then change the script type to “PowerCli 12 (PowerShell 7.1).

PowerShell Script Type

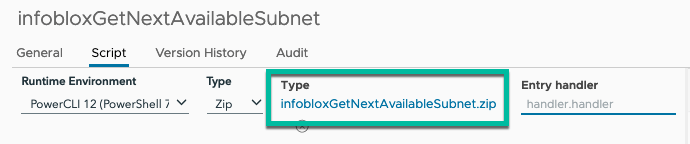
Change the Type to ‘Zip’ by clicking on the dropdown under ‘Type’ and selecting ‘Zip’

Click ‘Import’, then browse to the folder containing the zip file from earlier in the article.

You will notice the name is not ‘nextibsubnet.zip’ but InfobloxGetNextAvailableSubnet.zip. The imported zip assumes the name of the vRO Action.

Now the biggest difference between my approach and the VMware way. If you look at the cloned folder you will see a file named ‘getNextAvailableIbSubnet.ps1’. The VMware document called this file ‘handler.ps1’. Instead of putting in ‘handler.handler’ in ‘Entry Handler’, I’ll use ‘getNextAvailableIbSubnet.handler. This tells vRO to look inside ‘getNextAvailableIbSubnet.ps1’ for a function called ‘handler’.

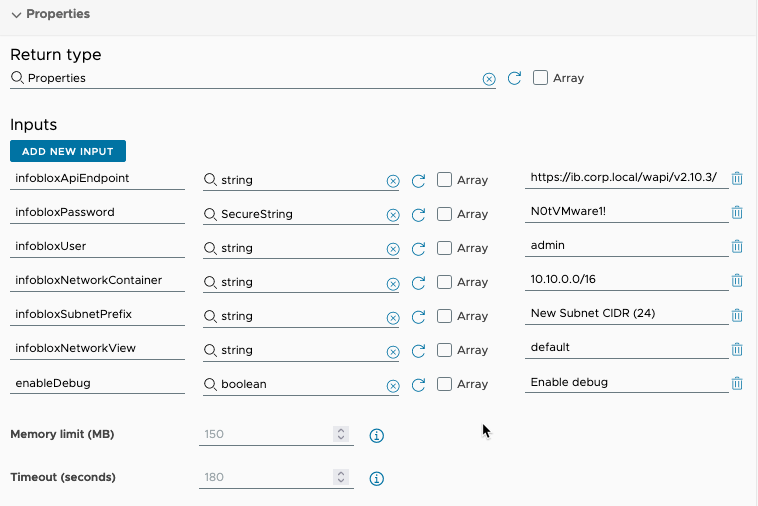
Next we need to change the return type to Properties, and add a few inputs.

Save and run. And if everything is in order, you should get the next InfoBlox subnet from 10.10.0.0/24. The results from the action run.

So there you go. Now on to the next adventure.

Packer HCL and PVSCSI drivers

Just this last week I was updating an old Packer build configuration from JSON to HCL. But for the life of me could not get a new vSphere Windows 2019 machine to find a disk attached to Para Virtualized disk controller.

I repeatedly received this error after the machine new machine booted.

Error

In researching error 0x80042405 in C:\Windows\pather\setuperr.log, I found it simply could not find the attached disk.

setuperr.log

After some research I determined the PVSCSI drivers added to the floppy disk where not being discovered. Or more specifically the new machine didn’t know to search the floppy for additional drivers.

I finally found a configuration section for my autounattend.xml file which would fix it after an almost exhaustive online search.

The magic section reads as follows.

<unattend xmlns="urn:schemas-microsoft-com:unattend">
    <settings pass="windowsPE">        
       <component name="Microsoft-Windows-PnpCustomizationsWinPE" processorArchitecture="amd64" publicKeyToken="31bf3856ad364e35" language="neutral" versionScope="nonSxS" xmlns:wcm="http://schemas.microsoft.com/WMIConfig/2002/State" xmlns:xsi="http://www.w3.org/2001/XMLSchema-instance">
            <DriverPaths>
                <PathAndCredentials wcm:action="add" wcm:keyValue="A">
                    <!-- pvscsi-Windows8.flp -->
                    <Path>A:\</Path>
                </PathAndCredentials>
            </DriverPaths>
        </component>
...
    </settings>

After adding this section, the new vSphere Windows machine easily found the additional drivers.

This was tested against Windows 2019 in both AWS and vSphere deployments.

The vSphere deployment took an hour, mostly waiting for the updates to be applied. AWS takes significantly less time as I’m using the most recently updated image they provide.

The working files are located in the packer-hcl-vsphere-aws github repo.

Code Stream Nested Esxi pipeline Part 1

Been a while since my last post. Over the last couple of months I’ve been tinkering with using Code Stream to deploy a Nested Esxi / vCenter environment.

My starting point is William Lams excellent PowerShell script (vsphere-with-tanzu-nsxt-automated-lab-deployment). I also wanted to use the official vmware/poweclicore docker image.

Well let’s just say it’s been an adventure. Much has been learned through trial and (mostly) error.

For example in Williams script, all of the files are located on the workstation where the script runs. Creating a custom docker image with those files would have resulted in a HUGE file, almost 16GB (Nested ESXi appliance, vCSA appliance and supporting files, and NSX-T OVA files). As one of my co-worker says, “Don’t be that guy”.

At first I tried cloning the files into the container as part of the CI setup. Downloading the ESXi OVA worked fine, but failed when I tried copying over the vCSA files. I think it’s just too much.

I finally opted to use a Kubernetes Code Stream instead of a Docker pipeline. This allowed me to use a Persistent Volume Claim.

Kubernetes setup

Some of the steps may lack details, as this has been an ongoing effort and just can’t remember everything. Sorry peeps!

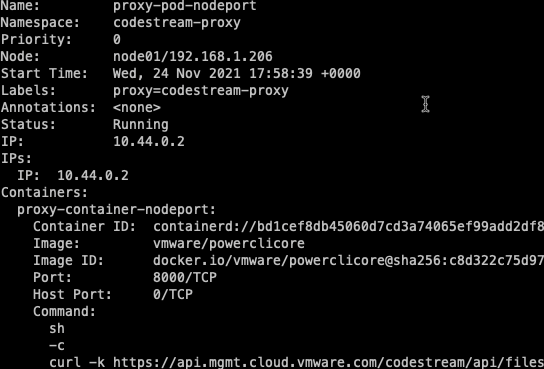
Create two Name Spaces, codestream-proxy and codestream-workspace. Codestream-proxy is used by Code Stream to host a Proxy pod.

Codestream-workspace will host the containers running the pipeline code.

Next came the service account for Code Stream. The path of least resistance was to simply assign ‘cluster-admin’ to the new service account. NOTE: Don’t do this in a production environment.

apiVersion: rbac.authorization.k8s.io/v1
kind: ClusterRoleBinding
metadata:
  name: cs-cluster-role-binding
roleRef:
  apiGroup: rbac.authorization.k8s.io
  kind: ClusterRole
  name: cluster-admin
subjects:
- kind: ServiceAccount
  name: codestream
  apiGroup: ""
  namespace: default

Next came the Persistent Volume (pv) and Persistent Volume Claim (pvc). My original pv was set to 20GI, which after some testing was determined too small. It was subsequently increased it to 30GI. The larger pv allowed me to retain logs and configurations between runs (for troubleshooting).

apiVersion: v1
kind: PersistentVolume
metadata:
  annotations:
  name: cs-persistent-volume-cw
spec:
  accessModes:
  - ReadWriteMany
  capacity:
    storage: 30Gi
  hostPath:
    path: /mnt/nested
  persistentVolumeReclaimPolicy: Retain
apiVersion: v1
kind: PersistentVolumeClaim
metadata:
  name: cs-pvc-cw
  namespace: codestream-workspace
spec:
  accessModes:
  - ReadWriteMany
  resources:
    requests:
      storage: 30Gi
  volumeName: cs-persistent-volume-cw

The final step in k8s is to get the Service Account token. In this example the SA is called ‘codestream’ (So creative).

k get secret codestream-token-blah!!! -o jsonpath={.data.token} | base64 -d | tr -d "\n"

eyJhbGciOiJSUzI1NiIsImtpZCI6IncxM0hIYTZndS1xcEdFVWR2X1Z4UFNLREdQcGdUWDJOWUF1NDE5YkZzb.........

Copy the token, then head off to Code Stream.

Codestream setup

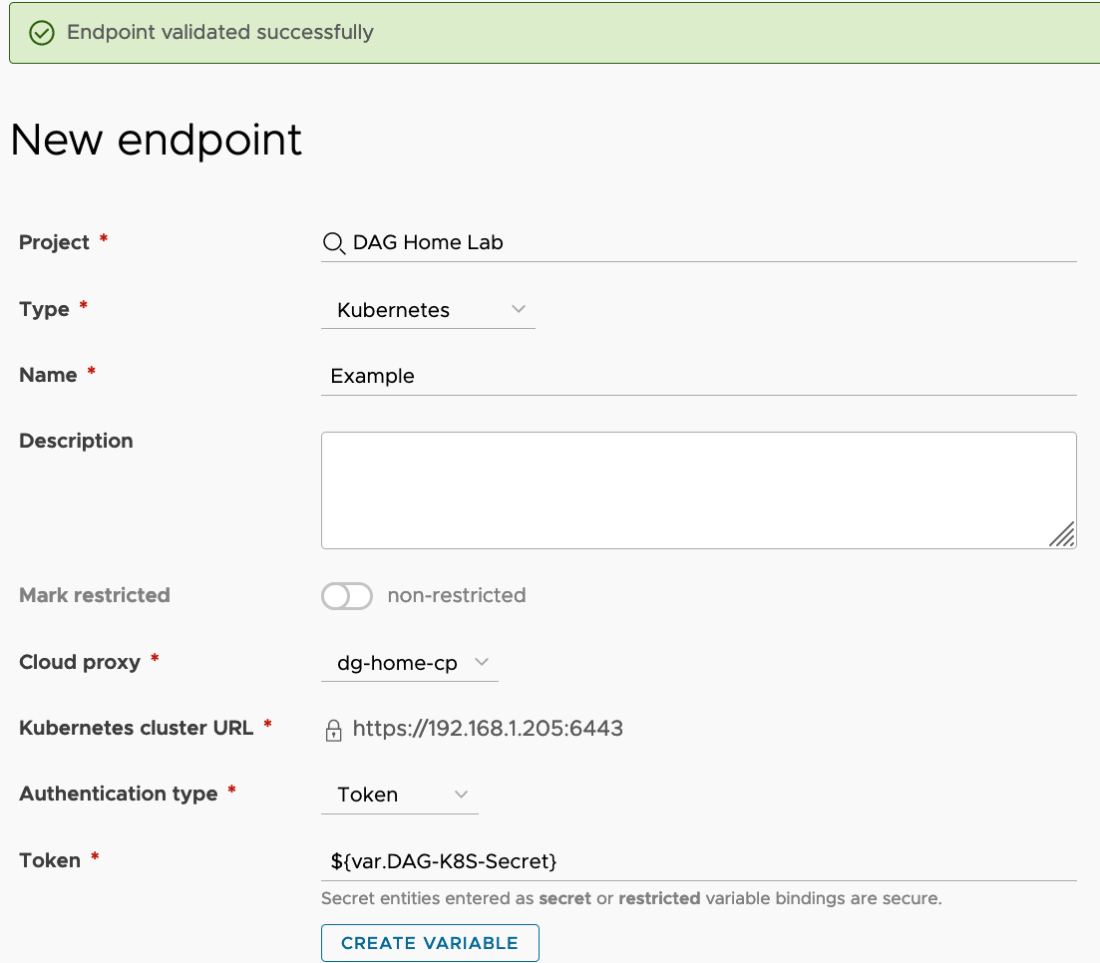
There I added a Variable to hold the token, called DAG-K8S-Secret.

Then went over to Endpoints, where I added a new Kubernetes endpoint.

Repo setup

The original plan was to download the OVA/OVF files from a repo every time the pipeline ran. However an error would occur on every VCSA file set download. Adding more memory to the container didn’t fix the problem, so I had to go in another direction.

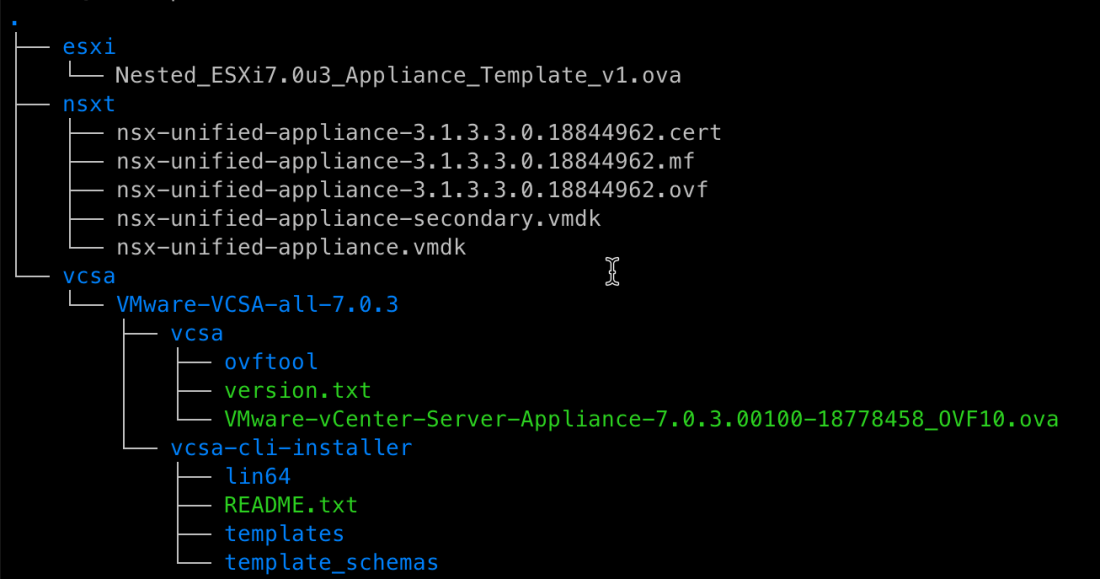
The repo is well connected to the k8s cluster, so the transfer is pretty quick. Here is the directory structure for the repo (http://repo.corp.local/repo/).

NOTE: You will need a valid account to download VCSA and NSX-T.

NOTE: NSX-T will be added to the pipeline later.

Simply copying the files interactively on the k8s node seemed like the next logical step. Yes the files copied over nicely, but any attempt to deploy the VCSA appliance would throw a python error complaining about a missing ‘vmware’ module.

However I was able to run the container manually, copy the files over and run the scripts successfully. Maybe a file permissions issue?

Finally I ran the pipeline with a long sleep at the beginning. Using an interactive session, and copied the files over. This fixed the problem.

Here are the commands I used to copy the files over interactively.

k -n codestream-workspace exec -it po/running-cs-pod-id bash
wget -mxnp -q -nH http://repo.corp.local/repo/ -P /var/workspace_cache/ -R "index.html*"
# /var/workspace_cache is the mount point for the persistent volume
# need to chmod +x a few files to get the vCSA to deploy
chmod +x /var/workspace_cache/repo/vcsa/VMware-VCSA-all-7.0.3/vcsa/ovftool/lin64/ovftool*
chmod +x /var/workspace_cache/repo/vcsa/VMware-VCSA-all-7.0.3/vcsa/vcsa-cli-installer/lin64/vcsa-deploy*

This should do it for now. The next article will cover some of the pipeline details, and some of the changes I had to make to William Lams Powershell code.

Happy holidays.

Changing vRealize Automation Cloud Proxy internal network ranges

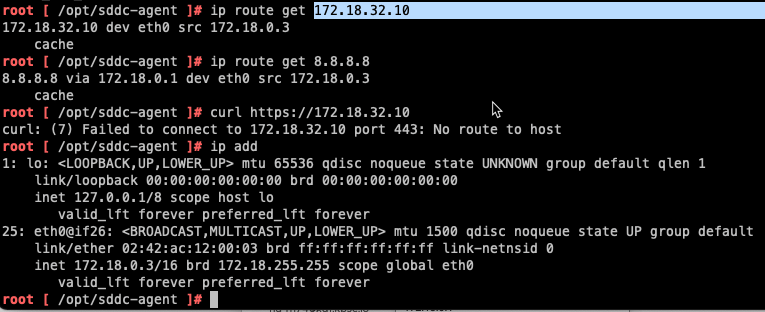
My current customer needs to use 172.18.0.0/16 for their new VMWare Cloud on AWS cluster. However we tried this in the past and were getting a “NO ROUTE TO HOST” error when trying to add the VMC vCenter as a cloud account.

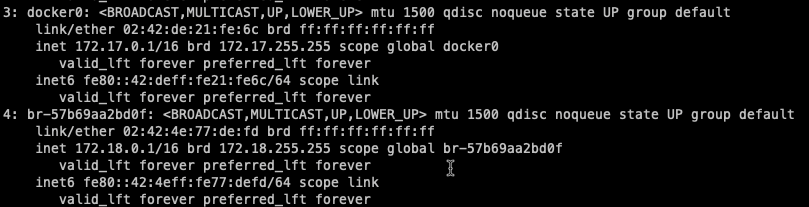
The problem was eventually traced back to the ‘on-prem-collector’ (br-57b69aa2bd0f) network in the Cloud Proxy which also uses the same subnet.

Let’s say the vCenters IP is 172.18.32.10. From inside cloudassembly-sddc-agent container, I try to connect to the vCenter. Eventually getting a ‘No route to host’ error. Can anyone say classic overlapping IP space?

We reached out to our VMWare Customer Success Team and TAM, who eventually provided a way to change the Cloud Proxy docker and on-prem-collector subnets.

Now for the obligatory warning. Don’t try this in production without having GSS sign off on it.

In this example I’m going to change the docker network to 192.168.0.0/24 and the on-prem-collector network to 192.168.1.0/24.

First to update the docker interface range.

Add the following two lines to /etc/docker/daemon.json. Don’t forget to add the necessary comma(s). Then save and close.

{
  "bip": "192.168.0.1/24",
  "fixed-cidr": "192.168.0.1/25"
}

Restart the docker service.

# systemctl restart docker

Now onto the on-prem-collector network.

Check to see which containers are using this network with docker network inspect on-prem-collector. Mine had two, cloudassembly-sddc-agent, cloudassembly-cmx-agent.

# docker network inspect on-prem-collector
[
    {
        "Name": "on-prem-collector",
        "Id": "57b69aa2bd0f694d76cc553769321deebcdb79e009e0964c4b5cc47aadb14684",
        "Created": "2021-02-10T16:05:21.953266873Z",
        "Scope": "local",
        "Driver": "bridge",
        "EnableIPv6": false,
        "IPAM": {
            "Driver": "default",
            "Options": {},
            "Config": [
                {
                    "Subnet": "172.18.0.0/16",
                    "Gateway": "172.18.0.1"
                }
            ]
        },
        "Internal": false,
        "Attachable": false,
        "Ingress": false,
        "ConfigFrom": {
            "Network": ""
        },
        "ConfigOnly": false,
        "Containers": {
            "05105324cff757d76de9e2f535cfb72d2e96094a630561aa141a40aa04095f00": {
                "Name": "cloudassembly-cmx-agent",
                "EndpointID": "8f6717a969b5a1edfea37b9e3d77565c38419de18774bebf4c3981e41c1ad017",
                "MacAddress": "02:42:ac:12:00:03",
                "IPv4Address": "172.18.0.3/16",
                "IPv6Address": ""
            },
            "b227cf1add6caca415b88f927fb10982b0cd846f71548f95071b65330e4024e1": {
                "Name": "cloudassembly-sddc-agent",
                "EndpointID": "4f802a81e0a5dfe50ca39675a5b5106a5fb647198f3bfa898f4f62793baad448",
                "MacAddress": "02:42:ac:12:00:02",
                "IPv4Address": "172.18.0.2/16",
                "IPv6Address": ""
            }
        },
        "Options": {},
        "Labels": {}
    }
]

Disconnect those two machines from the on-prem-collector network.

# docker ps
CONTAINER ID        IMAGE                                                                          COMMAND                  CREATED             STATUS              PORTS                      NAMES

05105324cff7        symphony-docker-external.jfrog.io/vmware/cloudassembly-cmx-agent:207           "./run.sh --lemansDa…"   4 days ago          Up 5 minutes        127.0.0.1:8004->8004/tcp   cloudassembly-cmx-agent

b227cf1add6c        symphony-docker-external.jfrog.io/vmware/cloudassembly-sddc-agent:4cda576      "./run.sh --lemansDa…"   4 days ago          Up 5 minutes        127.0.0.1:8002->8002/tcp   cloudassembly-sddc-agent

# docker network disconnect on-prem-collector b227cf1add6c
# docker network disconnect on-prem-collector 05105324cff7
# docker network inspect on-prem-collector
[
    {
        "Name": "on-prem-collector",
        "Id": "57b69aa2bd0f694d76cc553769321deebcdb79e009e0964c4b5cc47aadb14684",
        "Created": "2021-02-10T16:05:21.953266873Z",
        "Scope": "local",
        "Driver": "bridge",
        "EnableIPv6": false,
        "IPAM": {
            "Driver": "default",
            "Options": {},
            "Config": [
                {
                    "Subnet": "172.18.0.0/16",
                    "Gateway": "172.18.0.1"
                }
            ]
        },
        "Internal": false,
        "Attachable": false,
        "Ingress": false,
        "ConfigFrom": {
            "Network": ""
        },
        "ConfigOnly": false,
        "Containers": {},
        "Options": {},
        "Labels": {}
    }
]

Delete the on-prem-collector network, then re-add using the new subnet (using 192.168.1.0/24)

# docker network rm on-prem-collector
on-prem-collector
# docker network create --subnet=192.168.1.0/24 --gateway=192.168.1.1 on-prem-collector
47e3d477a87c4459f57e3a7305754b1d91e4d13e645ad4c160de5b8e64fede1a

Reconnect the two containers to the new docker network.

# docker network connect on-prem-collector 05105324cff7
# docker network connect on-prem-collector b227cf1add6c
# 
# docker network inspect on-prem-collector
[
    {
        "Name": "on-prem-collector",
        "Id": "47e3d477a87c4459f57e3a7305754b1d91e4d13e645ad4c160de5b8e64fede1a",
        "Created": "2021-05-18T15:58:55.019732144Z",
        "Scope": "local",
        "Driver": "bridge",
        "EnableIPv6": false,
        "IPAM": {
            "Driver": "default",
            "Options": {},
            "Config": [
                {
                    "Subnet": "192.168.1.0/24",
                    "Gateway": "192.168.1.1"
                }
            ]
        },
        "Internal": false,
        "Attachable": false,
        "Ingress": false,
        "ConfigFrom": {
            "Network": ""
        },
        "ConfigOnly": false,
        "Containers": {
            "05105324cff757d76de9e2f535cfb72d2e96094a630561aa141a40aa04095f00": {
                "Name": "cloudassembly-cmx-agent",
                "EndpointID": "34df13b0accf2f561e0226918a7e84d02995a25f4cc3969758a913a3f6c4e8bb",
                "MacAddress": "02:42:c0:a8:01:02",
                "IPv4Address": "192.168.1.2/24",
                "IPv6Address": ""
            },
            "b227cf1add6caca415b88f927fb10982b0cd846f71548f95071b65330e4024e1": {
                "Name": "cloudassembly-sddc-agent",
                "EndpointID": "405e7e8e1a4ad09b4cc99b0661454a4b0f32687152ca2346daf72f5a424dcd4d",
                "MacAddress": "02:42:c0:a8:01:03",
                "IPv4Address": "192.168.1.3/24",
                "IPv6Address": ""
            }
        },
        "Options": {},
        "Labels": {}
    }
]

Reboot and do the happy dance.

Happy not-coding.

Cloud Extensibility Appliance vRO Properties using PowerShell

In this article I’ll show you how to return JSON as a vRO Property type using vRA Cloud Extensibility Proxy (CEXP) vRO PowerShell 7 scriptable tasks.

First a couple of notes about the CEXP.

  • It is BIG, 32GB of RAM. However my lab instance is using less than 7 GB active memory.
  • 8 vCPU, and runs about 50% on average.
  • It deploys with 4 disks, using a tad less than 210 GB.

Why PowerShell 7? Well it was a design decision based on the customers PS proficiency.

Now down to the good stuff. Here are the details of this basic workflow using PowerShell 7 as Scriptable Tasks.

  • Get a new vRA Cloud Bearer Token
    • Save it, along with other common header values to an output variable named ‘headers’ (Properties)
  • The second scriptable task will use the header and apiEndpoint to GET the vRAC version information (About).
    • Then save version information to an output variable named ‘vRacAbout’ (Properties)

Getting (actually POST) the bearerToken is fairly simple. Here is the code for the first task.

function Handler($context, $inputs) {
    <#
    .PARAMETER $inputs.refreshToken (SecureString)
        vRAC Refresh Token

    .PARAMETER $inputs.apiEndpoint (String)
        vRAC Base API URL

    .OUTPUT headers (Properties)
        Headers including the bearerToken

    #>
    $body = @{ refreshToken = $inputs.refreshToken } | ConvertTo-Json

    $headers = @{'Accept' = 'application/json'
                'Content-Type' = 'application/json'}
    
    $Uri = $inputs.apiEndpoint + "/iaas/api/login"
    $requestResponse = Invoke-RestMethod -Uri $Uri -Method Post -Body $body -Headers $headers 

    $bearerToken = "Bearer " + $requestResponse.token 
    $authorization = @{ Authorization = $bearerToken}
    $headers += $authorization

    $output=@{headers = $headers}

    return $output
}

The second task consumes the headers produced by the first task, then GET(s) the Version Information from the vRA Cloud About route (‘/iaas/api/about’). The results are then returned as the vRacAbout (Properties) variable.

function Handler($context, $inputs) {
    <#
    .PARAMETER $inputs.headers (Properties)
        vRAC Refresh Token

    .PARAMETER $inputs.apiEndpoint (String)
        vRAC Base API URL

    .OUTPUT vRacAbout (Properties)
        vRAC version information from the About route

    #>
    $requestUri += $inputs.apiEndpoint + "/iaas/api/about"
    $requestResponse = Invoke-RestMethod -Uri $requestUri -Method Get -Headers $headers

    $output=@{vRacAbout = $requestResponse}

    return $output
}

Here, you can see the output variables for both tasks are populated. Pretty cool.

As you can see, using the vRO Properties type is fairly simple using the PowerShell on CEXP vRO.

The working workflow package is available here.

Happy coding.

vExpert 2021 Applications are open

The 2021 vExpert applications are now open!

The program “is about giving back to the community beyond your day job”.

One way I give back is by posting new and unique content here once or twice a month. Sometimes a post is simply me clearing a thought before the weekend, completing a commitment to a BU, or documenting something before moving on to another task. It doesn’t take long, but could open the door for one of my peers.

My most frequently used benefit is the vExpert and Cloud Management Slack channels. I normally learn something new every-week. And it sure does feel good to help a peer struggling with something I’ve already tinkered with.

Here’s a list of some of the benefits for receiving the award.

  • Networking with 2,000+ vExperts / Information Sharing
  • Knowledge Expansion on VMware & Partner Technology
  • Opportunity to apply for vExpert BU Lead Subprograms
  • Possible Job Opportunities
  • Direct Access to VMware Business Units via Subprograms
  • Blog Traffic Boost through Advocacy, @vExpert, @VMware, VMware Launch & Announcement Campaigns
  • 1 Year VMware Licenses for Home Labs for almost all Products & Some Partner Products
  • Private VMware & VMware Partner Sessions
  • Gifts from VMware and VMware Partners
  • vExpert Celebration Parties at both VMworld US and VMworld Europe with VMware CEO, Pat Gelsinger
  • VMware Advocacy Platform Invite (share your content to thousands of vExperts & VMware employees who amplify your content via their social channels)
  • Private Slack Channels for vExpert and the BU Lead Subprograms

The applications close on January 9th, 2021. Start working on those applications now.

vExpert Applications open

The midyear vExpert Applications are open until June 25th, 5 PM PDT.

What the heck is vExpert you may ask? The VMware vExpert program is VMware’s global evangelism and advocacy program. 

The award is for individuals who are sharing their VMware knowledge and contributing that back to their community.

How do you do that? Writing blog articles, participating in discussions on VMware Code (Slack), presenting at VMUG’s, etc.

What is in it for you? Promotion of your articles, exposure at global events, co-op advertising, traffic analysis, and early access to beta programs and VMware’s roadmap.

Other vExpert Program Benefits

  • Invite to the private #Slack channel
  • vExpert certificate signed by CEO Pat Gelsinger.
  • Private forums on communities.vmware.com.
  • Permission to use the vExpert logo on cards, website, etc for one year
  • Access to a private directory for networking, etc.
  • Exclusive gifts from various VMware partners.
  • Private webinars with VMware partners as well as NFRs.
  • Access to private betas (subject to admission by beta teams).
  • 365-day eval licenses for most products for home lab / cloud providers.
  • Private pre-launch briefings via our blogger briefing pre-VMworld (subject to admission by product teams)
  • Blogger early access program for vSphere and some other products.
  • Featured in a public vExpert online directory.
  • Access to vetted VMware & Virtualization content for your social channels.
  • Yearly vExpert parties at both VMworld US and VMworld Europe events.
  • Identification as a vExpert at both VMworld US and VMworld EU.

The application process is pretty simple, just visit the vExpert site, create and submit your application.

Don’t forget, the midyear applications close at 5PM PDT June 25th 2020.

vRA Cloud Sync Blueprint Versions to Github

The current implementation of vRealize Automation Cloud and Git integration for Blueprint is read only. Meaning you download the new Blueprint version into a local repo the push it. After a few minutes vRA Cloud will see the new version and update the design page. It’s really a pain if you know what I mean.

What I really wanted was to automatically push the new or updated Blueprint when a new version is created.

The following details one potential solution using vRA Cloud ABX actions in a flow on Lambda.

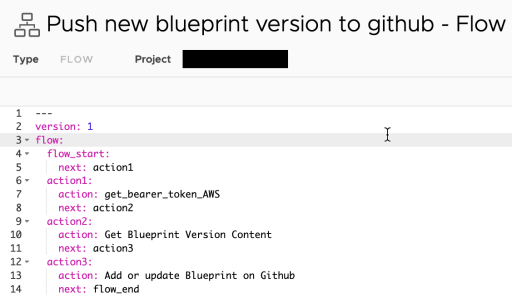
The flow consists of three parts.

  1. Retrieve a vRA Cloud refresh token from an AWS Systems Manager Parameter, then get a refresh token (get_bearer_token_AWS). It returns the bearer token as ‘bearer_token’.
  2. Get Blueprint Version Content. This uses ‘bearer_token’ to get the new Blueprint Version payload and return it as ‘bp_version_content’.
  3. Then Add or Update Blueprint on Github. This action converts the ‘bp_version_content’ from JSON into YAML. It also adds or updates the two required properties, ‘name’ and ‘version’. Both values come from the content retrieved from step two. It also clones the repo, checks to see if the blueprint exists. Then it either creates a Blueprint folder with blueprint.yaml, or updates an existing blueprint.yaml.

The vRA Cloud Refresh Token and Github API key are stored in an AWS SSM Parameter. Please take a look at one of my previous articles on how to set this up.

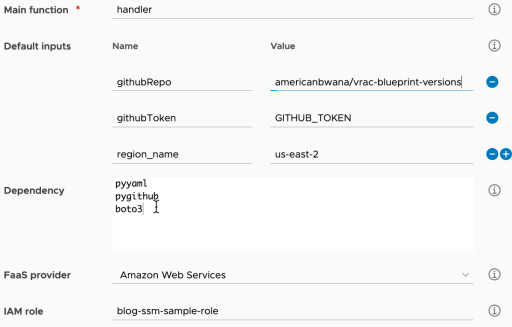
‘get_bearer_token_AWS’ has two inputs. region_name is the AWS region, and refreshToken is the SSM Parameter containing the vRA Cloud refresh token.

Action 2 (Blueprint Version Content) uses the bearer token returned by Action 1 to get the blueprint version content.

The final action, consumes the blueprint content returned by action 2. It has three inputs, githubRepo is the repo configured in your github project, githubToken is the SSM Parameter holding the Github key, and finally region_name is the AWS region where the Parameter is configured.

Create a new Blueprint version configuration subscription, using the flow as the target action, and filtering the event to “‘event.data.eventType == ‘CREATE_BLUEPRINT_VERSION'”.

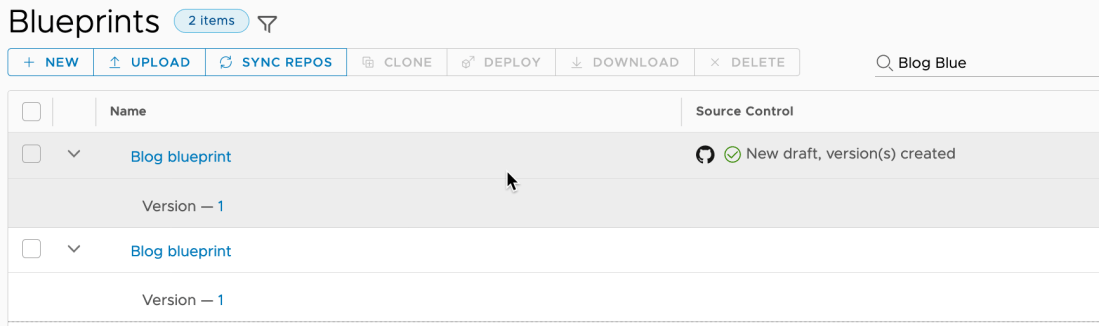
Now to test the solution. Here I have a very basic blueprint. Make sure you add the name and version properties. The name value should match the actual blueprint name. Now create a new Version. Then wait until Github does another inventory.

You may notice the versioned Blueprint will show up a second time, now being managed by Github. I think vRA Cloud is adding the discovered blueprints on Github with a new Blueprint ID. The fix is pretty easy, just delete the original blueprint after making sure the imported one still works.

The flow bundle containing all of the actions is available in this repository.

Spas Kaloferov recently posted a similar solution for gitlab. Here is the link to his blog.