Deploying vSphere Pods in VCF 9: A Beginner’s Guide

VCF Automation 9 presents some unique challenges for those of us who grew up with the old Aria Automation model. Change is ever present, though, so this old grumpy guy is learning the new model one practical lesson at a time.

For me, that learning starts with All Apps Organizations and Kubernetes-backed workloads. They are a different way to think about application delivery, and I have found that the quickest way to understand them is to deploy something small, observe what the platform does, and follow the evidence when it does not work as expected.

Today we are going to deploy a vSphere Pod in my VCF 9.1 environment. I will share what I tested, the capacity issue I encountered, and how I exposed the finished workload through a load balancer. Consider this a starting point for the lessons that follow, not a claim that the learning is finished.

Now, on to business.

Before we start clicking buttons, here is the shape of the experiment. We are going to create an All Apps Organization, create a namespace inside its default project, deploy a very small Nginx container, and then expose it through a load balancer. The point is not to build an exciting website. The point is to see which pieces of the platform have to agree before a vSphere Pod can run.

There are three ideas worth keeping in mind as we go. First, a vSphere Pod is a Kubernetes Pod managed by Supervisor, not a vSphere vApp. Second, the namespace carries more responsibility than its name suggests: it is tied to access, capacity, and networking. Third, a successful form submission is only the beginning of the evidence. We still need to see the instance become Ready and reach it from a client network.

We’ll start with a brand new VCF 9 deployment, either real or Holodeck. We’ll use a new All Apps Organization configured with the default settings. Your menu names and available options may vary slightly by release, but the sequence is the important part.

Now let’s see what happens when you try to deploy a pod in the default project called ‘default-project’.

First add a new namespace. Within the project, click Projects -> default-project -> Namespaces -> New. Wait for the namespace to become Active before moving on. That state is not just decorative: it tells us that VCFA has finished creating the namespace and its supporting configuration.
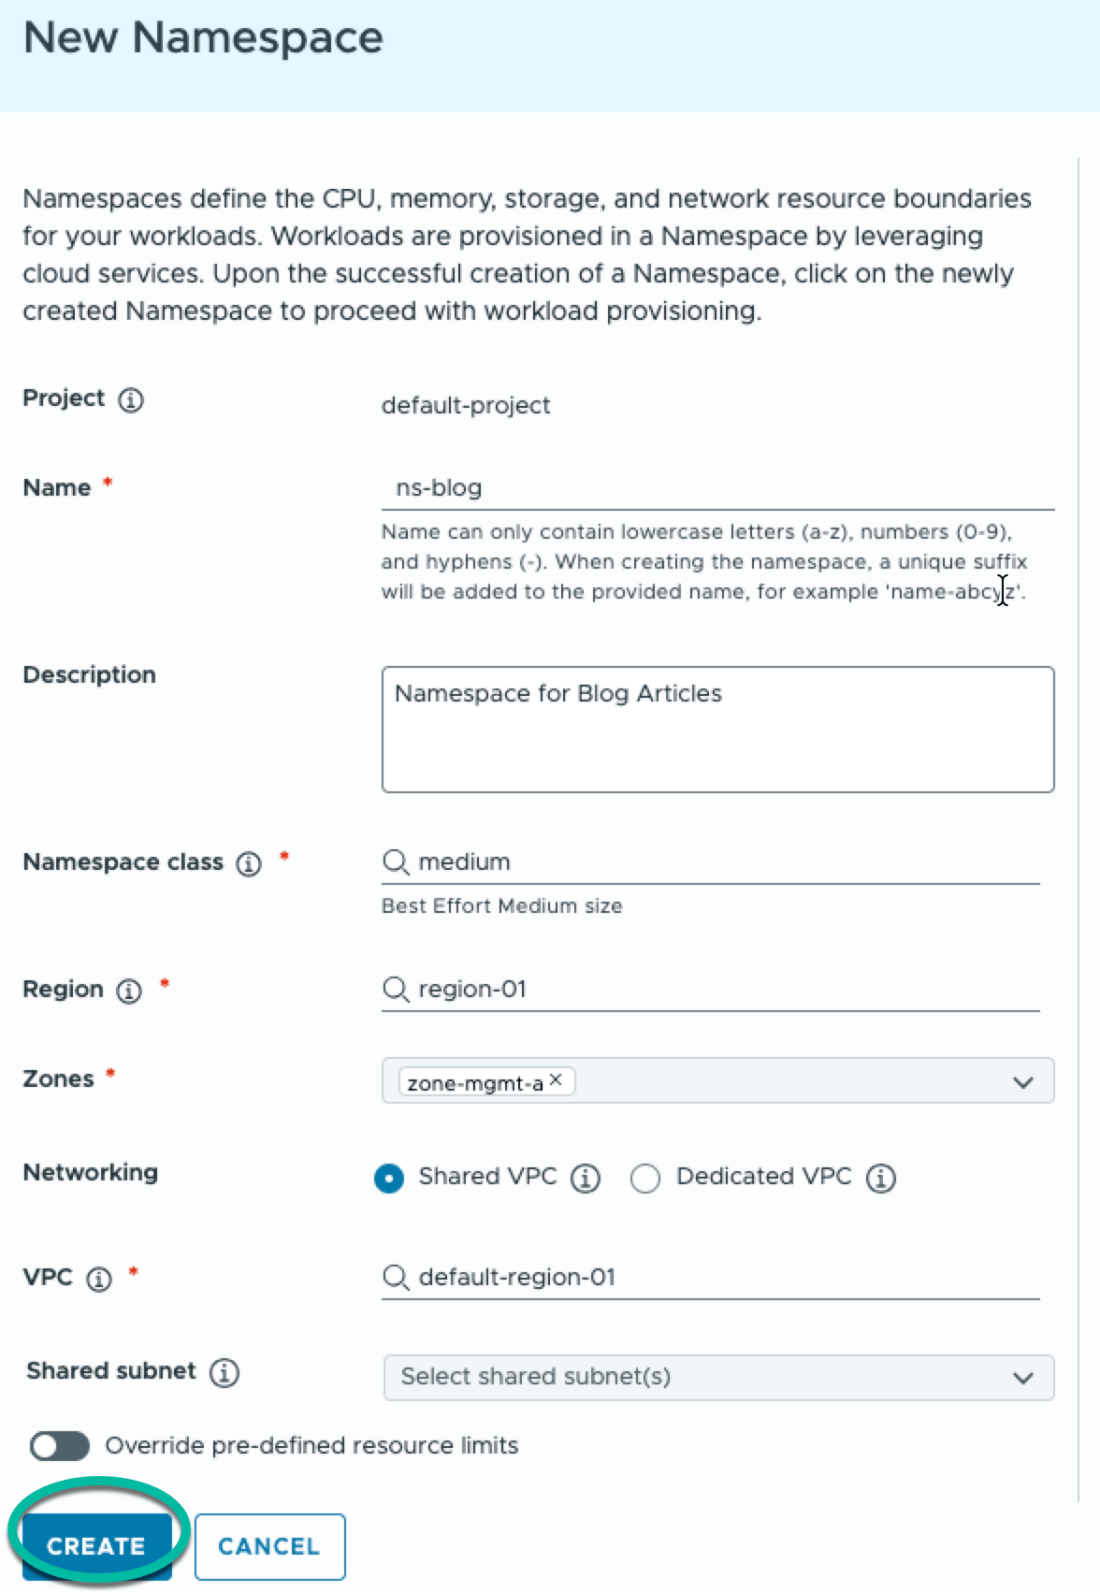
In my Holodeck environment, the namespace was created as ns-blog-2xtdh. After it became Active, I moved on to attempting to deploy a Pod. At this stage, nothing has contacted Harbor and no container has started. We have only established the place where the workload is allowed to live.

Under Build & Deploy, click Select a namespace. After selecting the namespace, you’ll see several resource options. The one in question is Container. Select that and click CREATE NEW INSTANCE.

And now we meet the first useful clue: a yellow warning. This is the point where it is tempting to assume that the new Organization must be broken. It is new, after all. Surely there cannot already be a capacity problem in an empty Organization.

But read the warning closely. It says Insufficient resource reservation. This is not an image-pull error, a Kubernetes application error, or a Harbor error. The platform is telling us that it cannot reserve enough underlying vSphere capacity for the PodVM.

This distinction matters. A container request is eventually backed by vSphere resources, and VCFA checks those resources before the Pod is scheduled. If the request cannot be admitted, the platform never reaches the point where it could pull an image. Changing a registry password at this stage would be a wonderfully energetic way to solve the wrong problem.

Let’s get that fixed. Go back to the namespace through Manage & Govern -> Namespaces, and edit the namespace we just created. There are two related places to inspect: the Organization’s Region Quota and the namespace’s own resource limits.

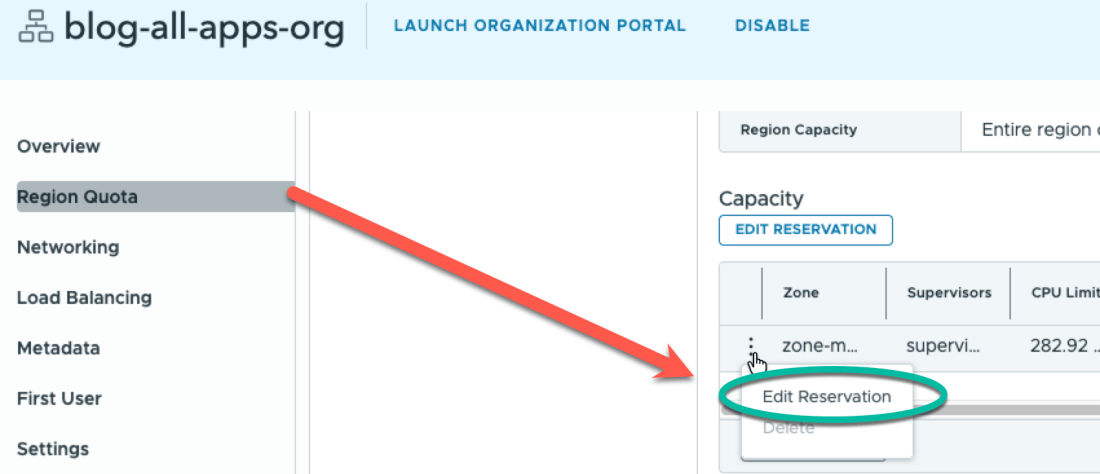
In the Provider Management Portal, select the Organization and open Region Quota. Then click Edit Reservation next to the relevant Zone. This was the first part that took me a while to find. The setting is not hiding in the container request, because it belongs to the provider and Organization capacity model.
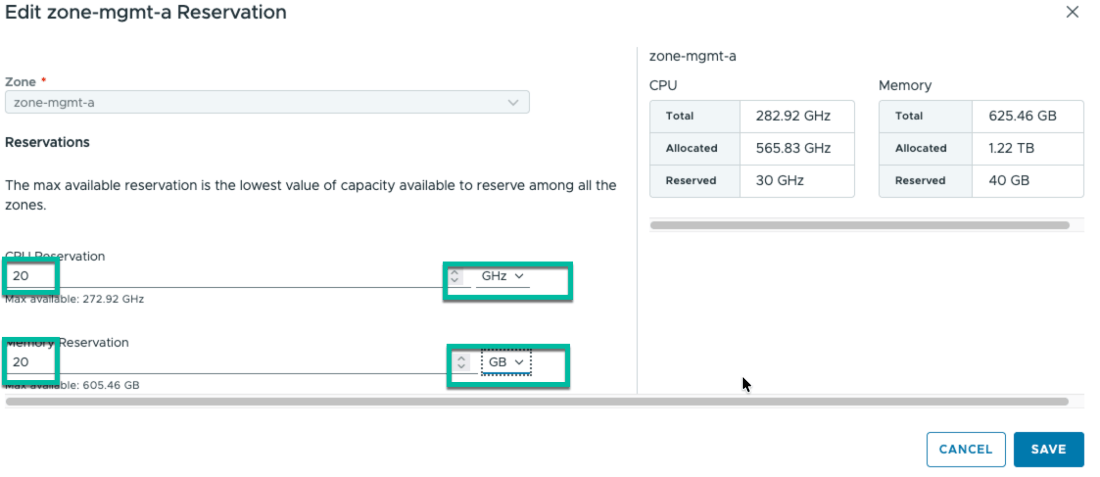
Change the CPU reservation and Memory reservation. I’ll keep the values small-ish, using 19 GHz and 19 GB to get started. These are lab values, not a universal recommendation. The correct numbers depend on the capacity available to the Region, the Organization’s other workloads, the Namespace Class, and the number of replicas you expect to run.

But we still get that warning. There must be somewhere else we need to update. Yep: the Organization quota is only one layer. We still need to update the namespace itself. Click EDIT RESOURCE LIMITS, then update the values.

Do not simply enter the full 20 GHz and 20 GB in both places if the parent reservation is 20 and the platform needs to account for the rest of the allocation. VCFA performs its own capacity calculations and can decide that the child reservation would exceed what the parent can provide. Leave a little room while you are learning the model, and increase the parent and child values deliberately rather than guessing.
Now let’s see if we can deploy that container. That is better, we got past the warning page. We’ll keep most of the values at their defaults for this first pass, but I’ll call out the ones we change. The image below comes from Docker Hub, which keeps this first test focused on scheduling and basic container execution rather than private-registry authentication.

OptionValue
Primary Container Imagedocker.io/library/nginx:alpine
Requested CPU250 millicores
Requested Memory256 MB

If all goes well, you’ll end up with a Ready container instance in a short while. “Ready” is useful, but it has a specific meaning: the platform has admitted the resource and the workload has passed its readiness checks. It does not automatically tell us that an external client can reach the application.

We should also see a Running Instance. At this point, we have proved that VCFA and Supervisor can create and run the workload in the namespace. We have not yet proved that our laptop, browser, or Holodeck client has a route to it.

But woe is me, I can’t reach the Pod to view the page, boring though it may be. Why? The Pod landed on a private VPC network. That is not necessarily a failed deployment. It means the workload has an address on a network that my client cannot directly reach.

This is another useful boundary to remember: a Pod IP is not automatically an externally reachable application endpoint. The namespace determines the Pod’s primary network. To provide a client-facing address, we need a Kubernetes Service and a load-balancer provider, plus routing and firewall policy that allow the client to get there.

Let’s redo this, only this time add a load balancer during the request. We’ll use the same settings until we reach Advanced Setting (Optional). Expand Load Balancer, then click ATTACH LOAD BALANCER. We will expose HTTP port 80 and send it to port 80 in the primary container.

NameValue
Nameblog-lb
New port Namehttp
New port ProtocolTCP
New port Port80
New port Target80
Attach to Primary ContainerChecked (Yes)

Click ADD, then SAVE. Click NEXT to review and confirm your choices, and finally click CREATE CONTAINER INSTANCE.

If all went well, we should have a Ready service shortly. Click the new instance to find the load-balancer address, then browse to it to validate the deployment.

The important difference is that the load balancer gives the client a frontend address while the Pod remains on its workload network. The Service still needs a healthy backend, and the network path still needs to work, so an allocated address is a good sign but not the final test.
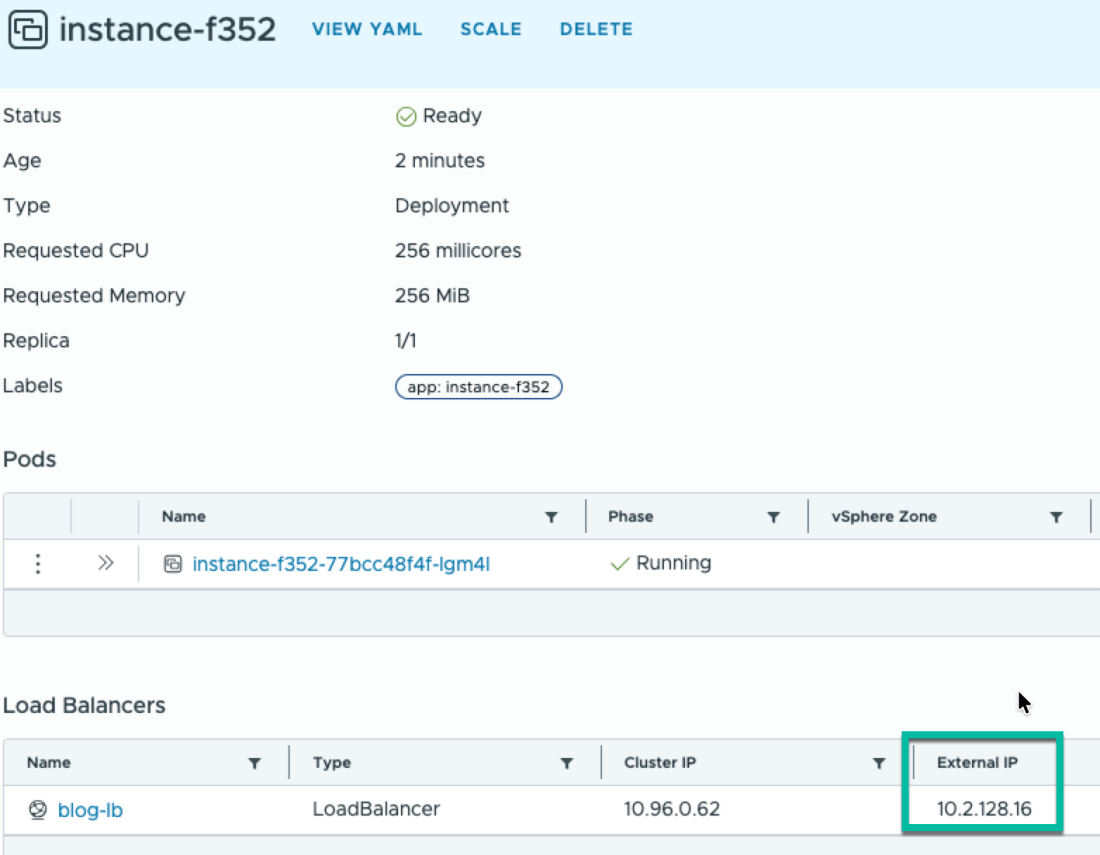
Hey, it worked!
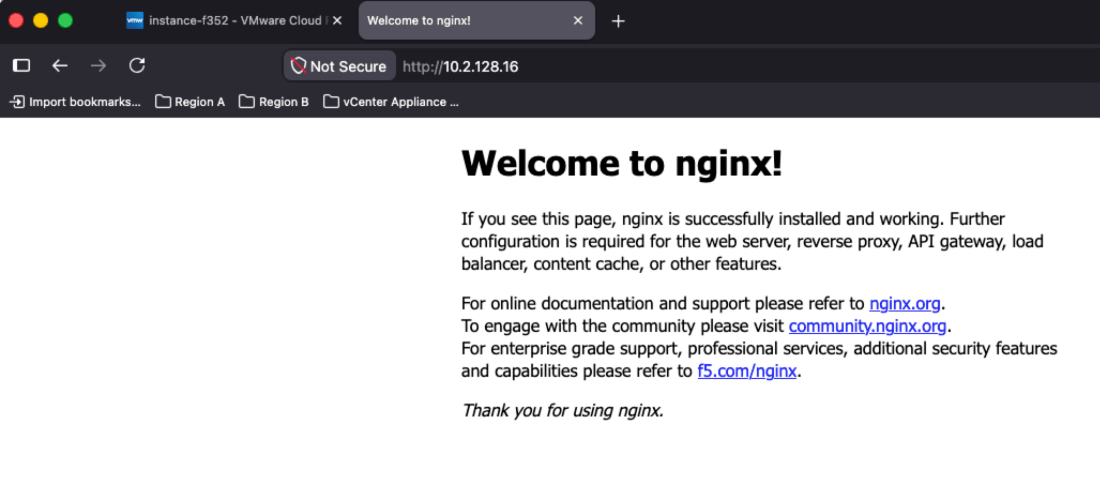
There you go. We started with a new All Apps Organization, discovered that a fresh environment can still have insufficient capacity, corrected the Region Quota and namespace limits, deployed a vSphere Pod, found that its private network was not directly reachable, and then exposed it through a load balancer.

That is a useful first pass because each step tells us something different. The Ready instance proves that the workload was admitted and started. The load-balancer request proves that we asked the platform for an external frontend. The browser test proves that the client can actually reach the application. Those are three different claims, and keeping them separate makes the troubleshooting much easier.

Up next is setting up a local Harbor container registry and using a private image instead of docker.io. That introduces a few new characters: TLS trust, registry credentials, namespace-scoped image-pull Secrets, and the ESXi image-pull path. But that is for another day.

Disclaimer: Some of the stuff you see here has been checked out, tweaked, or even created by AI. Welcome to the new age, folks!

Mastering VCF 9 All Apps Organization Virtual Machine IP Discovery

VCF Automation CCI blueprint VM primary IP address

Getting a VM’s IP address sounds like it should be the easy part of an automation project. In my VCF Automation lab, it turned into one of those small details that consumed far more time than expected.

First some background on my lab environment. Using Holodeck I deployed a single Management Domain, Supervisor, Automation. On top of that I added a single All Apps Organization.

My goal was simple: Deploy an All Apps Organization virtual machine through a CCI.Supervisor.Resource, wait for the VM and its guest network to be ready, and return the assigned IPv4 address as a deployment output. I found an example that pointed me toward status.network.primaryIp4. It was close—but close does not count when a property name is case-sensitive.

My ultimate intent here, is to use that IP address or addresses as part of a three tier application blueprint. But that is another blog.

The path that worked in my environment was:

status.network.primaryIP4

The IP is uppercase. That capitalization was the difference between an empty or unusable value and the address I needed.

Following the VM’s actual status

The breakthrough came from looking at the status returned for the deployed VM instead of continuing to guess at the schema. The VM’s status.conditions array showed the conditions it passed through as provisioning progressed. The same status object exposed the network data under:

status:
network:
primaryIP4: 192.0.2.25

The lesson here is simple: Use the object returned by your own VCF Automation and VM Operator version as the source of truth. Blog posts and examples are useful starting points, but a small schema or capitalization difference can break a binding expression.

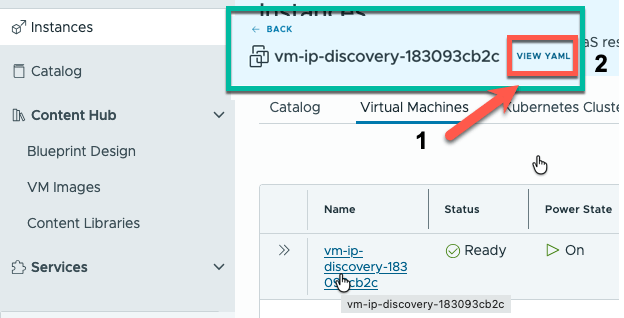
Steps to finding that information.

  1. Deploy the machine
  2. View YAML on the machine page
Steps to finding the deployed machine YAML.
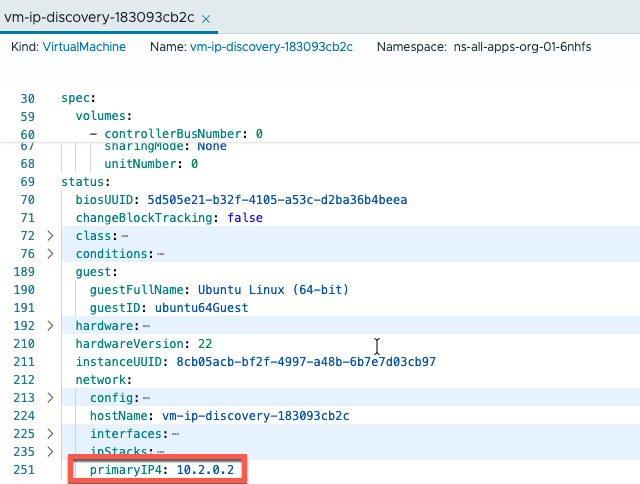
  1. Walk the properties (I collapsed several sections to enhance readability). Here the path to primaryIP4 is status.network.primaryIP4.
All Apps status.network.primaryIP4 path.

How to find the conditions

Follow the same logic as finding primaryIP4. You will find the conditions or stages the machine went through along with the ‘status‘ and 'reason‘.

All Apps Org machine condition or state transition's properties.

Why the wait block matters

Reading the right path is only half of the solution. VCF Automation also needs to wait long enough for the Supervisor resource status to contain the network information.

Broadcom documents a status-collection race in VCF Automation 9.0.x. Without an explicit wait, the resource can be considered created before its reconciled status has been synchronized back to Automation. Broadcom’s minimum recommendation is to wait for VirtualMachineCreated=True.

For my blueprint, I waited for VM creation, VMware Tools, guest network synchronization, and a value matching an IPv4 pattern:

resources:
Supervisor_VM:
type: CCI.Supervisor.Resource
properties:
context: ${resource.Supervisor_Namespace.id}
manifest:
apiVersion: vmoperator.vmware.com/v1alpha5
kind: VirtualMachine
metadata:
name: ${input.vmName}
spec:
# The rest of the sanitized VM manifest goes here.
wait:
timeoutSeconds: 1800
conditions:
- type: VirtualMachineGuestNetworkConfigSynced
status: 'True'
reason: Synced
- type: VirtualMachineCreated
status: 'True'
- type: VirtualMachineTools
status: 'True'
jsonPath:
- path: '{.status.network.primaryIP4}'
regex: \d{1,3}\.\d{1,3}\.\d{1,3}\.\d{1,3}

Return the address as a blueprint output

Once the wait completes, the address can be exposed as a deployment output. With the resource named Supervisor_VM, the binding is:

outputs:
vmIp:
type: string
title: VM primary IPv4 address
value: ${resource.Supervisor_VM.object.status.network.primaryIP4}

Again, the working property is primaryIP4, not primaryIp4.

This output can also be consumed by another resource binding. For example, an application VM could receive a database VM’s address during cloud-init. Make sure the upstream VM’s wait block completes before relying on that value.

Validation

After deploying a new version of the blueprint:

  1. Confirm the deployment completes without a wait timeout.
  2. Inspect the CCI.Supervisor.Resource object and verify that status.conditions includes the expected successful conditions.
  3. Verify that status.network.primaryIP4 contains the VM’s address.
  4. Confirm the deployment output shows the same address.
  5. From an appropriate network location, test the service that should be listening on that address.

The last step matters. VirtualMachineCreated=True, synchronized guest networking, and a populated primaryIP4 prove that the platform has an address for the VM. This does not prove that cloud-init finished successfully or that the application inside the guest is healthy.

Here is a screenshot of a deployed machine with the output vmIp set to 10.2.0.2.

 Displaying primaryIP4 as an vmIp output

The finished blueprint

The blueprint used in this blog is available here, VCF Automation Supervisor VM IP Discovery on GitHub

Take Aways

  1. Leverage AI to do the heavy research. One of the responses gave me the thought to check that case sensitivity.
  2. AI, also mean’s ‘Ain’t Intelligent’. It WILL send you down the wrong path eventually. As the developer you still need to know what it SHOULD look like in the end. In other words, trust but verify.
  3. Don’t get in a hurry. I worked on this on and off in my ‘spare time’ for a few days. Then finally it clicked at the end.
  4. All Apps Organizations are a new construct for most of us. The available public content and samples are few and far between. Please, Please, Please take some time to share your lessons learned with the community.

References

Nuff for now. Happy automating.

VMware PKS Bosh CLI client SSL trust

This past week or so has been spent deploying VMware PKS Enterprise in my lab.  My main installation guide was provided by Pivotal’s Installing Enterprise PKS on vSphere with NSX-T.  

All was going well until I tried to deploy a cluster.  I could see the machines being deployed in vCenter and various NSX-T components being deployed.  However, the cluster deployment failed with the following error.

Name:                     cluster-03
Plan Name:                small
UUID:                     ad4ba957-35bc-4500-ace8-1cfda0238a83
Last Action:              CREATE
Last Action State:        failed
Last Action Description:  Instance provisioning failed: 
..... task-id: 289, ... result: 2 of 7 pre-start scripts failed. Failed Jobs: ...

As you can see task 289 failed.  Now how the heck do I get the details of the failed task?

The bosh cli client appeared to be the answer. Reading further it looked like I needed to set some environment variables to make it work properly.

After reading a few online documents, I was able to find the Bosh Command Line Credentials (Actually the bosh environment variables) by clicking on the Bosh Tile in Operations Manager, clicking on the Credentials tab, then clicking the link next to Bosh Commandline Credentials.

boshCreds

The provided BOSH_CA_CERT path and file do not exist on my jump machine.  I was able to download the root CA following these steps. (Installing uaac is beyond the scope of this document).

uaac target https://opsman.corp.local/uaa --skip-ssl-validation

uaac token owner getClient ID: opsman
Client secret:
User name: admin
Password: *******

uaac contexts

Copy the admin bearer token from the client_id section (the token is actually called access_token).

[0]*[https://pks.pks.corp.local:8443]

  skip_ssl_validation: true

  ca_cert: root_ca_certificate

  [0]*[admin]

      client_id: admin

      access_token: eyJhbGci .....

      token_type: bearer

Finally downloading the certificate to my jump machine.

curl https://opsman.corp.local/api/v0/security/root_ca_certificate -X GET -H "Authorization: Bearer eyJhbGci ....." -k > root_ca_certificate

My reformatted bosh environment settings, along with the correct path to my certificate ended up like this.

export BOSH_CLIENT=ops_manager 
export BOSH_CLIENT_SECRET=MP0................Blah! 
export BOSH_CA_CERT=/root/root_ca_certificate <--- Correct path and file
export BOSH_ENVIRONMENT=bosh.corp.local

After pasting the variables into my console, I attempted to get the details from the failed task.

bosh task 289 
Validating Director connection config:
  Parsing certificate 1: Missing PEM block
Exit code 1

What the heck?  Apparently the downloaded certificate is actually in JSON format, AND it includes ‘\n’ as line returns.

{"root_ca_certificate_pem":"-----BEGIN CERTIFICATE-----\nMIIDUDCC...
...
....
cQswzKxnm8ZfedoVheV9OBnYQyrHV2ePG/W+kfCoqXD\n ....
CeEzZD6ZicGuv7KcYNP\n...\n-----END CERTIFICATE-----\n"}

Using Notepad ++ I replaced all of the ‘\n’ with a line return.

nppFandR

Then I removed the quotes, brackets , root_ca_certificate.pem section, and deleted all of the other newlines leaving me with a clean certificate (Each line needs to be 64 characters long).

formattedCert

After saving this on my machine, I attempted to run the command again, this time using the –ca-cert option pointing to the new certificate.

bosh task 289 --ca-cert root_ca_2.pem 
Using environment 'bosh.corp.local' as client 'ops_manager'

Task 289
....

Task 289 | 16:58:24 | Updating instance master: master/51431548-e35a-471b-853f-26dc7eca9f7c (0) (canary) (00:02:06)

                    L Error: Action Failed get_task: Task ...
Task 289 | 17:00:30 | Error: Action Failed get_task: ...
Task 289 Started  Wed May  8 16:55:34 UTC 2019
Task 289 Finished Wed May  8 17:00:30 UTC 2019
Task 289 Duration 00:04:56
Task 289 error

Capturing task '289' output:
  Expected task '289' to succeed but state is 'error'
Exit code 1

Success!

Now all all I need to do is figure out the error.  Oh joy!